As a mathematician, I am pulled to the latest news about COVID-19. In particular, I am drawn to looking at the numbers of confirmed cases, especially in the United States where I live. I realize that these numbers are skewed for a variety of different reasons, and I am not about to get all political or scientific about why that might be. Rather, I would like to examine three different functions: The Linear Function, The Quadratic Function, and The Exponential Function.
The Linear Function
The Linear Function is useful for describing (or “modeling”) the following kind of situation: Wilbur has $30 in his piggy bank and saves an additional $2 each day.
For this situation Wilbur would have $30, then $32, then $34, and so on. After 14 days he would have $30 + $2(14) or $58. Once we attach variables and create a table and a graph, the situation would look like this, and hence the descriptor “linear”.

Created at desmos.com.
The Linear Function makes a line when you graph it because the rate of change is constant. In Wilbur’s case, the rate of change is $2 per day. We have a lot of experience with linear functions in our daily lives, especially as we think about saving up for a special item.
The Quadratic Function
The Quadratic Function is useful for modeling projectile motion. Shooting a basketball, hitting a softball, launching a rocket, or even dropping a spoon off a highchair, are all examples of projectile motion. When an object is propelled into the air, its height increases at a decreasing rate until it reaches its maximum height and then starts coming back down. Here is an example of projectile motion. A golf ball is hit from the fairway with an initial velocity of 30 meters per second.
For this situation the ball starts on the ground so the height is 0, but then after one second the height is 25 because the Earth’s gravity is pulling the ball back to the ground at around 10 meters per second squared. Once we attach variables (x for seconds and y for height in meters), we can examine the equation, table and the graph.

Created at desmos.com.
The quadratic function is also useful for modeling area, which is why we call it “quadratic” since quad means four. The area of a square (four sides!) of unknown side length x would be x times x or “x squared”.
The Exponential Function
The Exponential Function is useful for modeling how money grows in a bank with a steady interest rate, since the interest earns interest. The Exponential Function is also useful for modeling how communicable disease spreads, since infected people infect other people. With this novel virus (COVID-19) for which we have no vaccine (yet) and no effective anti-viral (yet), we are experiencing exponential behavior. Imagine there are 300 people with a confirmed case of COVID-19. This number doubles every three days, How many cases will there be in 15 days?
Hmmm… At the start 300
3 days later 600, 3 days after that 1200… let me make a table.
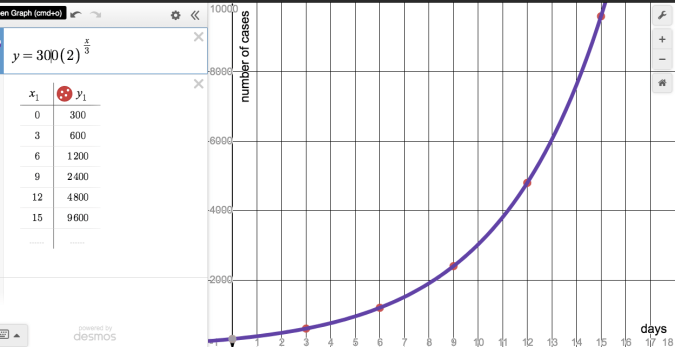
Created at desmos.com.
Notice how the variable is in the exponent of the equation which is why we call the function exponential. This table doesn’t seem that alarming, especially given the population size of the United States. But if you carry it out for another 15 days…

(Days, Confirmed Cases)
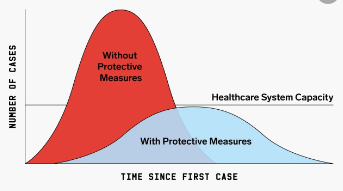
… we all of a sudden have 10% of the population infected, a significant portion of whom need to be hospitalized in isolation on ventilators. If you then realize that our hospitals are not equipped to handle this many cases, you can better understand all the efforts made by various groups to postpone events and limit gathering sizes, etc. These efforts are an attempt to “flatten the curve” which will allow people to be treated with the medical personnel, facilities, and equipment that we currently have.
Here my musings quickly swerve out of the algebra one lane into the calculus lane. The graph of an epidemic is not exponential, rather it is logistic. It appears exponential at the outset, but once we reach that inflection point, and maintain our social distancing practices well beyond that, the number of cases will continue to increase but at an decreasing rate like so:
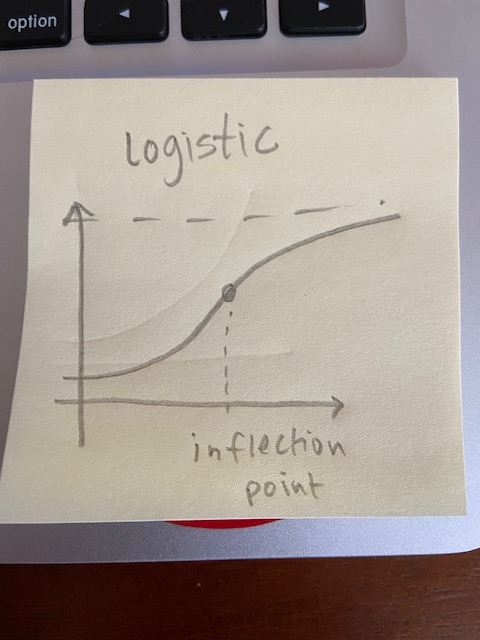
There are many ways to predict exactly when that inflection point will be, but again we are working with pretty questionable data at this point. For example, in some places it is taking as many as 4 days for a person tested for COVID-19 to be told whether or not they have the virus. Also, different parts of the country have different climates, population densities, and median ages so that will have an effect on the rate of the spread.
Tune in next time when I write about the derivative and the antiderivative of the logistic function. Until then

Police Lyrics on the Lyric Theatre Marquee
FREE Linear, Quadratic, and Exponential Function Matching Activity: click here

Nice lesson!
On Tue, Mar 17, 2020 at 3:10 PM Math, Teaching, and Teaching Math wrote:
> virgecornelius posted: “As a mathematician, I am pulled to the latest news > about COVID-19. In particular, I am drawn to looking at the numbers of > confirmed cases, especially in the United States where I live. I realize > that these numbers are skewed for a variety of different r” >
Virge, Similarly I have gotten to talk about the logistic curve and its relation to our current pandemic. One simple analogy I have used is the spreading of the rumor in school and if we maintain our “social” distancing we don’t have the rate of growth as much as the other way of using a small room with mouse traps and ping pong balls to set them off. The seminar I really enjoy that hits what is going on right now is a talk by Deborah Hughes-Hallett regarding the SARS outbreak that I attended at a TI conference. Sad that many of us our not in the classroom right now to share a very rich and powerful lesson and how math is instrumental in making high level governmental decisions.
I have a feeling you might end up analyzing the graphs per region.
I have a college who is tracking the data!
this is good and now i know how linear quad and exponential and explain something.
Great!